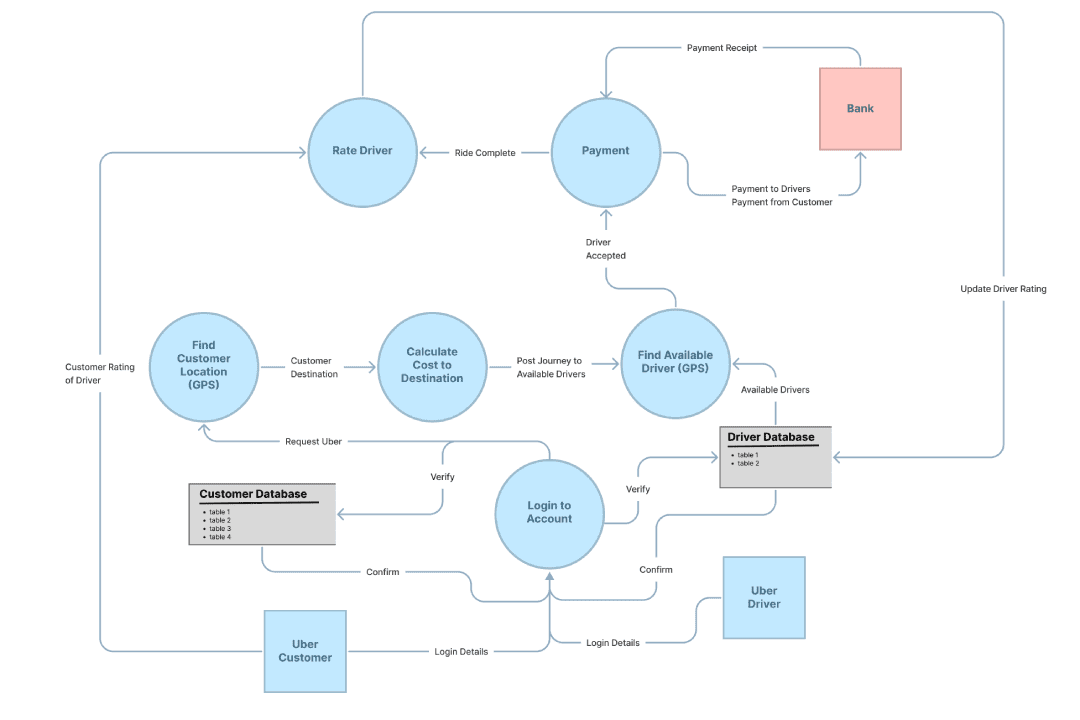
A good way to start is to work with words to think through sequences. We start from describing the need and problem in a user story.
We might start to think of key screens in the interface thats why We usually thinks in terms of starting and ending points.
Draw arrows between the boxes to define the space between the key screens and move the user forward through their task.
A Data Flow Diagram shows how processes flow through a system. There are some benefits of it:
At ZestGeek, we use Data Flow Diagrams (DFDs) to map the movement of data across your application. These visual schematics help align teams, reduce complexity, and ensure that every part of your system communicates efficiently. A high-level view of the entire system showing how it interacts with external entities like users, APIs, or services. More detailed breakdowns showing how data flows between internal processes, data stores, and modules, clearly defining inputs, outputs, and logic. When working with distributed systems, we create service-level data flow charts to illustrate how APIs exchange data and trigger events. Our diagrams also help identify potential security checkpoints and performance bottlenecks early in the planning process.